
Please be aware that the following blog contains information around and discussion of death and ‘risk of death’ in clinical trials which some readers may find upsetting.
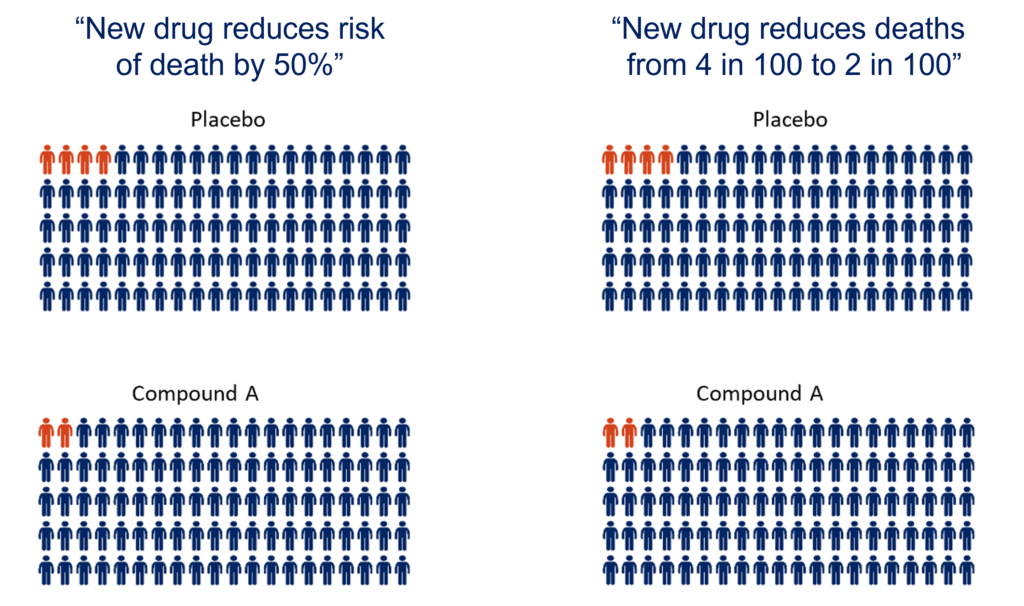
“New drug reduces risk of death by 50%”
You may have seen this type of headline in news articles reporting on the outcome of clinical trials. Understandably reading this headline can lead people to believe a potential drug is highly beneficial and has a real impact. However, it is important to delve a little deeper into the meaning of ‘risk of death’, the raw data behind it, and how it should be considered alongside other outcome measures of a trial to fully determine how effective a drug might be.
What is ‘risk of death’?
‘Risk of death’ is the number of people who die in a specific population over a given period of time.
In clinical trials, the ‘risk of death’ is the number of people in the trial who die during the trial. Risk of death can be calculated for both the participants who receive the placebo and those who receive a new potential treatment.
Example 1
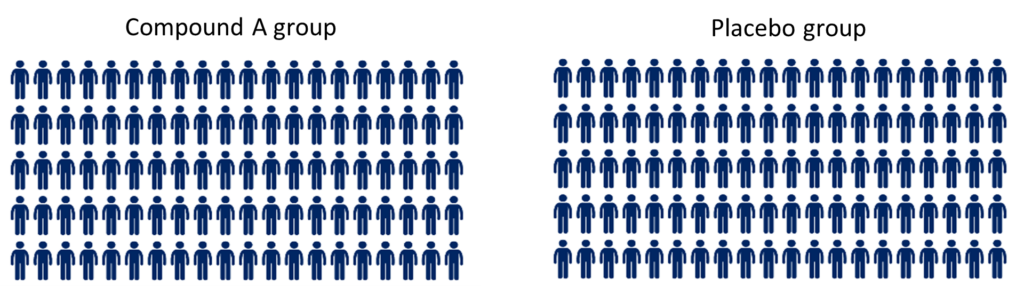
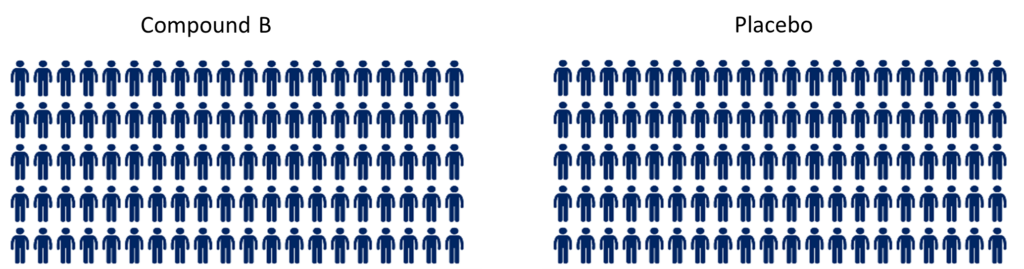
Imagine there is a clinical trial testing Compound A for 24-weeks. In the trial, 200 participants are randomly assigned evenly to two groups, with 100 people in each group. One group of 100 receive Compound A and the other group of 100 receives the placebo (dummy drug).
In this example, the primary outcome was survival. Therefore, at the end of the trial the number of people who died in each group is recorded.
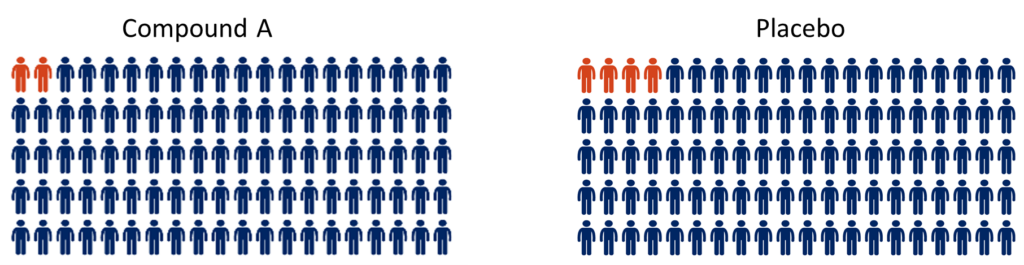
In the Compound A group, two people died, while in the placebo group four people died by the end of the trial period.
The headline from this trial might be:
“Compound A reduces the risk of death by 50%”
Calculating reduction in the risk of death – the maths behind the headline
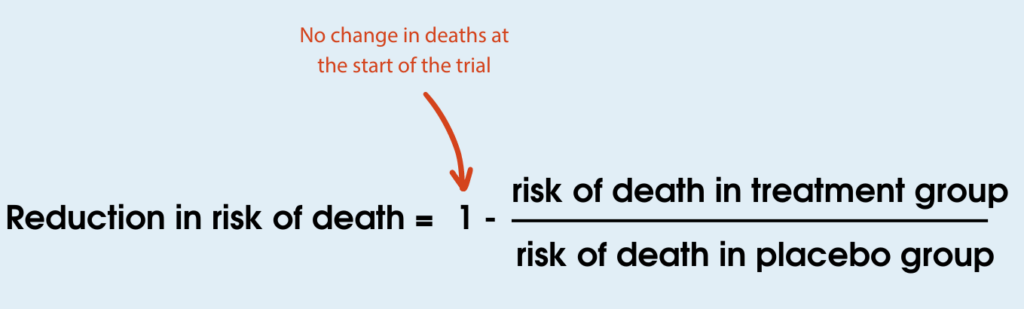
First, we need to calculate the risk of death in each group:

Then we can use the risk of death of both groups to calculate the reduction in risk of death:
In this example, 50% fewer people died in the treatment group compared to the placebo group. This makes it sound like Compound A has a significant benefit for people in this trial. However, when you look at the actual data you can see that only two fewer people died in the treatment group compared to the placebo group. This suggests there isn’t a large effect of the treatment. As the numbers are small, the difference observed could even be due to chance. Given the natural variation between people and disease progression, it is possible that if this trial was repeated the numbers could be completely different.
Hopefully it is now clear to see how caution should be applied when reading a headline quoting a % reduction in risk of death, and how it can be open to over-interpretation. It is also important to realise that the statistical calculation does not reflect the lived experience/quality of life of the people in the trial, it is merely a snapshot of deaths at the end of the trial period.
Now let’s look at another theoretical clinical trial that gives exactly the same result for ‘% reduction in risk of death’ (50%) but may actually be a more realistic representation of the results.
Example 2
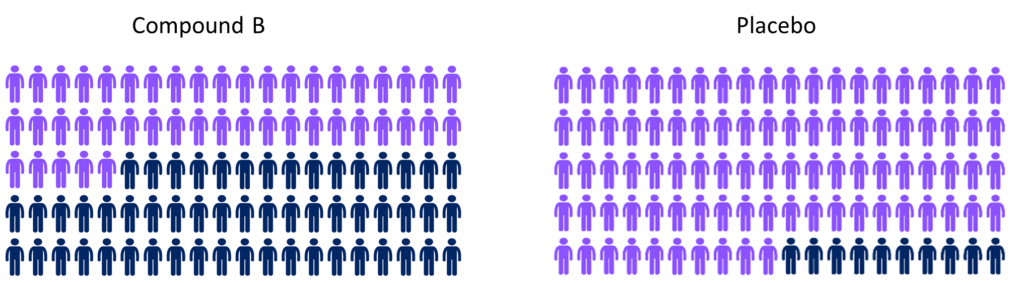
There is another clinical trial testing Compound B for 24-weeks. In the trial 200 participants are randomly assigned to receive either Compound B or the placebo (dummy drug) in a 1:1 ratio. Just as in the previous example, this means that 100 participants are randomly assigned to take Compound B and 100 are randomly assigned to take placebo for 24-weeks.
At the end of the trial the number of people who died in each group was recorded. In the Compound B group, 45 of the 100 people died while in the placebo group 90 of the 100 people died.
The headline from this trial would also be:
“Compound B reduces the risk of death by 50%”
By looking at the numbers of people (the figure above) this looks like a more genuine effect of the drug, as the data suggests that there may be a real difference between the groups here, and effects are unlikely to be down to random chance.
These examples show that the reduction in risk of death can be the same even though the actual numbers of deaths are very different.

RELATED POST
Website | MND Association
What are clinical trials?
Interpreting clinical trials
As mentioned throughout this blog, it is important to look at the context when analysing a clinical trial. The trial data we have shown only looks at a single snapshot of time when the number of deaths is totalled for the statistics. None of these statistics consider the quality of life, how participants feel, how the disease has progressed in those participants who are still alive or lived experiences of people in the trial. The data does not tell us how beneficial the treatment may be after the trial has ended, or how much it has slowed the progression of MND. Therefore, it is important to look at the risk of death alongside other outcome measures to fully determine how beneficial a treatment may be.
Sensational stand-alone headlines quoting reduced risk of death statistics from a clinical trial should be considered with caution. A comprehensive and critical evaluation is essential to avoid misinterpretation and to ensure decisions regarding potential treatments are grounded in a solid understanding of evidence. A statistically significant reduction in risk of death may not always translate into a meaningful improvement in patient outcomes.
Clinical trials are critical in the hunt for new effective treatments, and hopefully one day, a cure for MND. Carefully interpreting clinical trial data will help the whole community determine how beneficial a potential new treatment might be. This data can then be used to support the planning of further trials, further development of the treatment and potential regulatory approval.
Clinical trials would not be possible without the people who take part in them. We are so grateful for their sacrifice which helps us move towards our vision of a world free of MND.
We welcome any feedback on this blog. Please use the comments below or get in touch on research@mndassociation.org.