
Weight loss is a problem for many people living with MND, with approximately 20% of people already having lost 10% of their weight at diagnosis. Some of this weight loss may be due to a person experiencing difficulties with chewing and swallowing because of increased muscle weakness. It could be due to a lack of appetite because of tiredness, anxiety or low mood. It can also be caused by hypermetabolism which is when the body uses more energy than is being consumed, even without exercise, and is seen in some people with MND. Studies have shown that weight loss is linked to shorter survival.
At the 34th International Symposium on ALS/MND in Basel, Switzerland one of the sessions looked at nutritional assessment and management, with talks covering feeding tube management, the decision-making process of feeding tube placement, how diet might help slow progression, alternative ways to measure nutritional state and how appetite is controlled in the brain. In this series of five blogs, we are going to look a little closer at each of these studies and their potential for helping people living with MND. This is blog four in the series.
Dr Sarah Roscoe, from the University of Sheffield, presented the findings from her PhD work that investigated the role of anthropometric measurements to assess nutritional state in MND.
Nutritional state is defined as ‘the extent to which the metabolic demands for energy and nutrients are met’ or, simply put, how much the body’s needs for energy and nutrients are fulfilled. It has been previously suggested that around two thirds of people with MND do not take in sufficient calories to meet the body’s demand. There may be many reasons for this, but most are related with reasons not related to muscle weakness which can cause problems with dexterity and chewing and swallowing.
A decline in nutritional state is associated with a rapid decline in function and a poorer prognosis. Nutritional state is commonly assessed by regular weight measurements, with a loss of 5-10% of body weight used to indicate malnutrition. However, weight measurements are often difficult to obtain from people with reduced mobility and, where it is possible, when used in isolation do not give accurate measurements of body composition.
Body composition can very simply be broken down into ‘fat’ and ‘fat-free’ mass and it is very important to be able to differentiate between the two in people living with MND because a decline in fat-free mass, or skeletal muscle, is directly related to the loss of muscle and associated weakness seen in MND. And, as we know, this causes functional and respiratory problems. A decline in fat mass is associated with a prolonged energy imbalance which can go on to cause the onset of malnutrition-associated fat loss, increasing the risk of pressure ulcers and sores, particularly in those with reduced mobility.
Sarah’s study aimed to evaluate the role of a range of nutritional biomarkers to better understand the nutritional state of people living with MND.
Using anthropometric measurements to assess nutritional state
Anthropometry is the study of the proportions and composition of the human body. In this study, measurements were taken of the mid-upper arm and the calf circumference of participants. These measurements have previously been used as indicators of weight and BMI in other diseases. However, because these measurements encompass bone, fat and skeletal muscle it is not possible to differentiate between fat and fat-free mass when these measurements are used on their own. A measurement was also taken of the tricep skinfold thickness as a simple measure of fat-mass directly under the skin (Figure 1). This measurement was used together with the mid-upper arm measurement to calculate measurements of the arm muscle area, which was used as an indicator of upper arm fat-free body mass. For the purposes of this study, measurements were taken from both the left and right sides of participants as muscle wasting may not be equal on both sides in people with MND. No significant difference was found between each side so the average of these measurements was used.
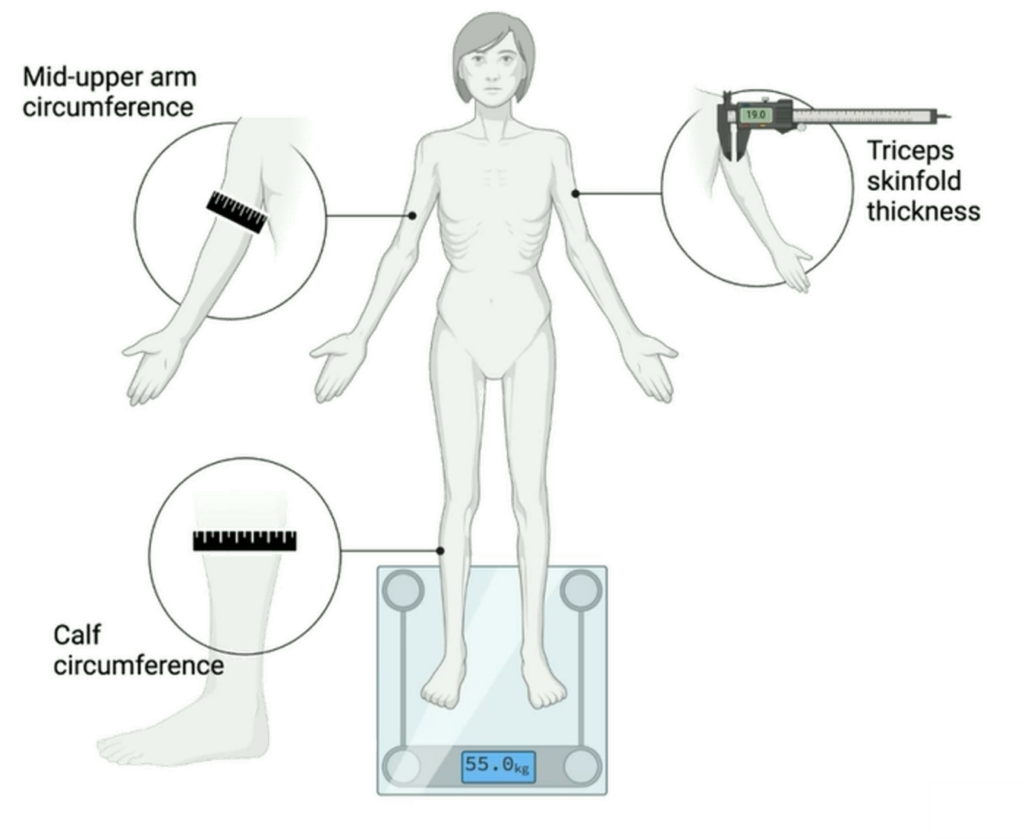
Figure 1. Illustration showing areas of anthropometric measurements. Reproduced from Dr Roscoe’s slides, International Symposium on ALS/MND 2023
The purpose of the study was to confirm that using these measurements to assess nutritional state in people with MND was practical, fast, low-cost and easy to carry out in the clinic and to see how, over a period of time, they compared to body weight, BMI and functional decline measurements.
Functional decline was measured using a self-administered ALSFRS-R where participants compared their current symptoms to the time before symptom onset, with a lower score indicating a decline in function since symptom onset. The ALSFRS-R score can either be presented as a total score out of 48 or broken down into the four subdomains – gross motor, fine motor, bulbar and respiratory.
The study recruited 24 participants and measurements were taken at baseline (the first measurements taken at recruitment into the study) and then at three monthly intervals over the next 9-10 months. By the end of the study, 14 participants remained for the final follow-up.
At baseline participants had an average weight of 80kg and a BMI of 26 so the group can be described as overweight, despite an average weight loss of 5% compared to before symptom onset. The average functional decline was 0.6 units/month on the ALSFRS-R so the group can be described as slow progressors (average decline on the ALSFRS-R is usually about 1 point per month). The average duration of symptoms was 27 months.
By using an average of the measurements there was a significant relationship between both weight and BMI and all the anthropometric measurements used.
The researchers wanted to track the changes in body weight over time for the 14 participants who completed all four timepoints. When the measurements are looked at in the group as a whole, there are no significant changes to body weight. However, when the percentage change in body weight is looked at in individuals between month zero, the baseline assessment, and month nine, the final assessment, there is high variability in the 14 participants, with five of the participants having a weight loss of more than 5% over the study period.
The researchers wanted to better understand the body changes that were happening in these individuals. In her presentation, Sarah highlighted one individual who had experienced a 7% loss in body weight over the study period to demonstrate her findings.
In simple terms, this person not only lost weight, which was reflected in reduced arm and calf measurements, but also experienced a considerable decrease (21%) in the muscle area of the upper arm (fat-free mass). Interestingly, there was a 13% increase in tricep skinfold thickness, which is an indicator of fat mass. These findings suggest that an increase in fat mass might be hiding a significant decline in skeletal muscle which is not detected when using weight measurements alone.
They also wanted to compare how their limb anthropometric measurements correlated against functional decline and a significant decline was seen when using the total ALSFRS-R score. Using the average score of each participant a significant negative relationship was seen between the total ALSFRS-R score, weight, triceps skinfold thickness and calf circumference.
What did they find?
When participants were divided into two groups of those with scores above or below the average ALSFRS-R score of 30.68, it was found that those with scores below the average showed a significant increase in their estimated fat mass (measured by triceps skinfold thickness). This was unexpected and lead the researchers to explore this further.
They discovered a strong negative relationship between the thickness of the triceps skinfold (a measure of fat) and the ALSFRS-R gross motor subscore, which includes questions about a person’s physical function relating to turning in bed, walking and climbing stairs. Simply put, the data showed that as physical activity decreased, the estimate of fat mass increased. These findings align with previous research showing that a slight increase in fat accompanies a more significant loss of lean body mass in people with MND. Although this might result in an overall loss of body weight, considering the energy storage capacity per unit of fat mass and fat-free mass, the authors of this previous research concluded that this increase in fat mass may actually contribute to a positive increase in the potential for energy storage within the body that could be beneficial for people with MND. In fact, there are ongoing studies exploring the potential advantages of a high-fat diet for people living with the condition.

RELATED POST
Blog | 12 January 2023 | Mandy Spencer
Why is understanding hypermetabolism important in ALS outcomes?
However, when the researchers examined how the body was using fuel in this group using a method called indirect calorimetry (a method of measuring how many calories are burned by measuring the amount of oxygen consumed and carbon dioxide produced during metabolism) they found a shift towards a higher preference for carbohydrate use over fat oxidation as the disease progressed. In simpler terms, the body seemed to be relying more on carbohydrates than fat for energy as the disease advanced.
What does this mean for people living with MND?
- Weight is currently often the only measurement used to assess nutritional state in MND – this is impractical and not a true indication of nutritional state.
- This study has shown promising data and that the limb anthropometric measurements may be practical and clinically accessible tools to assess nutritional state in MND.
- However, to ensure that these measurements are valid tools, the team are currently comparing them to more technologically advanced assessments of whole-body composition.
- The most striking result from this study is that increases in fat mass may be masking a more drastic, clinically significant decline in skeletal muscle and this would not be detected using weight measurements alone.
- The study also demonstrates that those with reduced function have an increase in fat mass. Would this relationship reverse following the onset of malnutrition associated fat loss which may occur later as the disease progresses?
- Previous studies have suggested that a small increase in fat mass may be beneficial, but Sarah’s study observed a shift towards the utilisation of carbohydrates and away from fats with disease progression.
- To better understand this, current projects aim to understand if whole-body fuel utilisation, when measured using indirect calorimetry, is reflected at the cellular level of these individuals.
The International Alliance of ALS/MND Associations held a webinar in February 2024 that discussed nutrition in ALS/MND – its importance, nutritional changes after diagnosis, considerations for bulbar onset ALS/MND and the myths and benefits of feeding tubes. You can watch the video below.
Part five in this series of nutritional assessment and management blogs will look at how brain imaging can be used to assess appetite control in people with MND.
None of this research would be possible with the people living with MND who take part, and those who support them. We thank them for their trust and time.